Bitcoin ETF flows: from record outflows to whiplash recovery
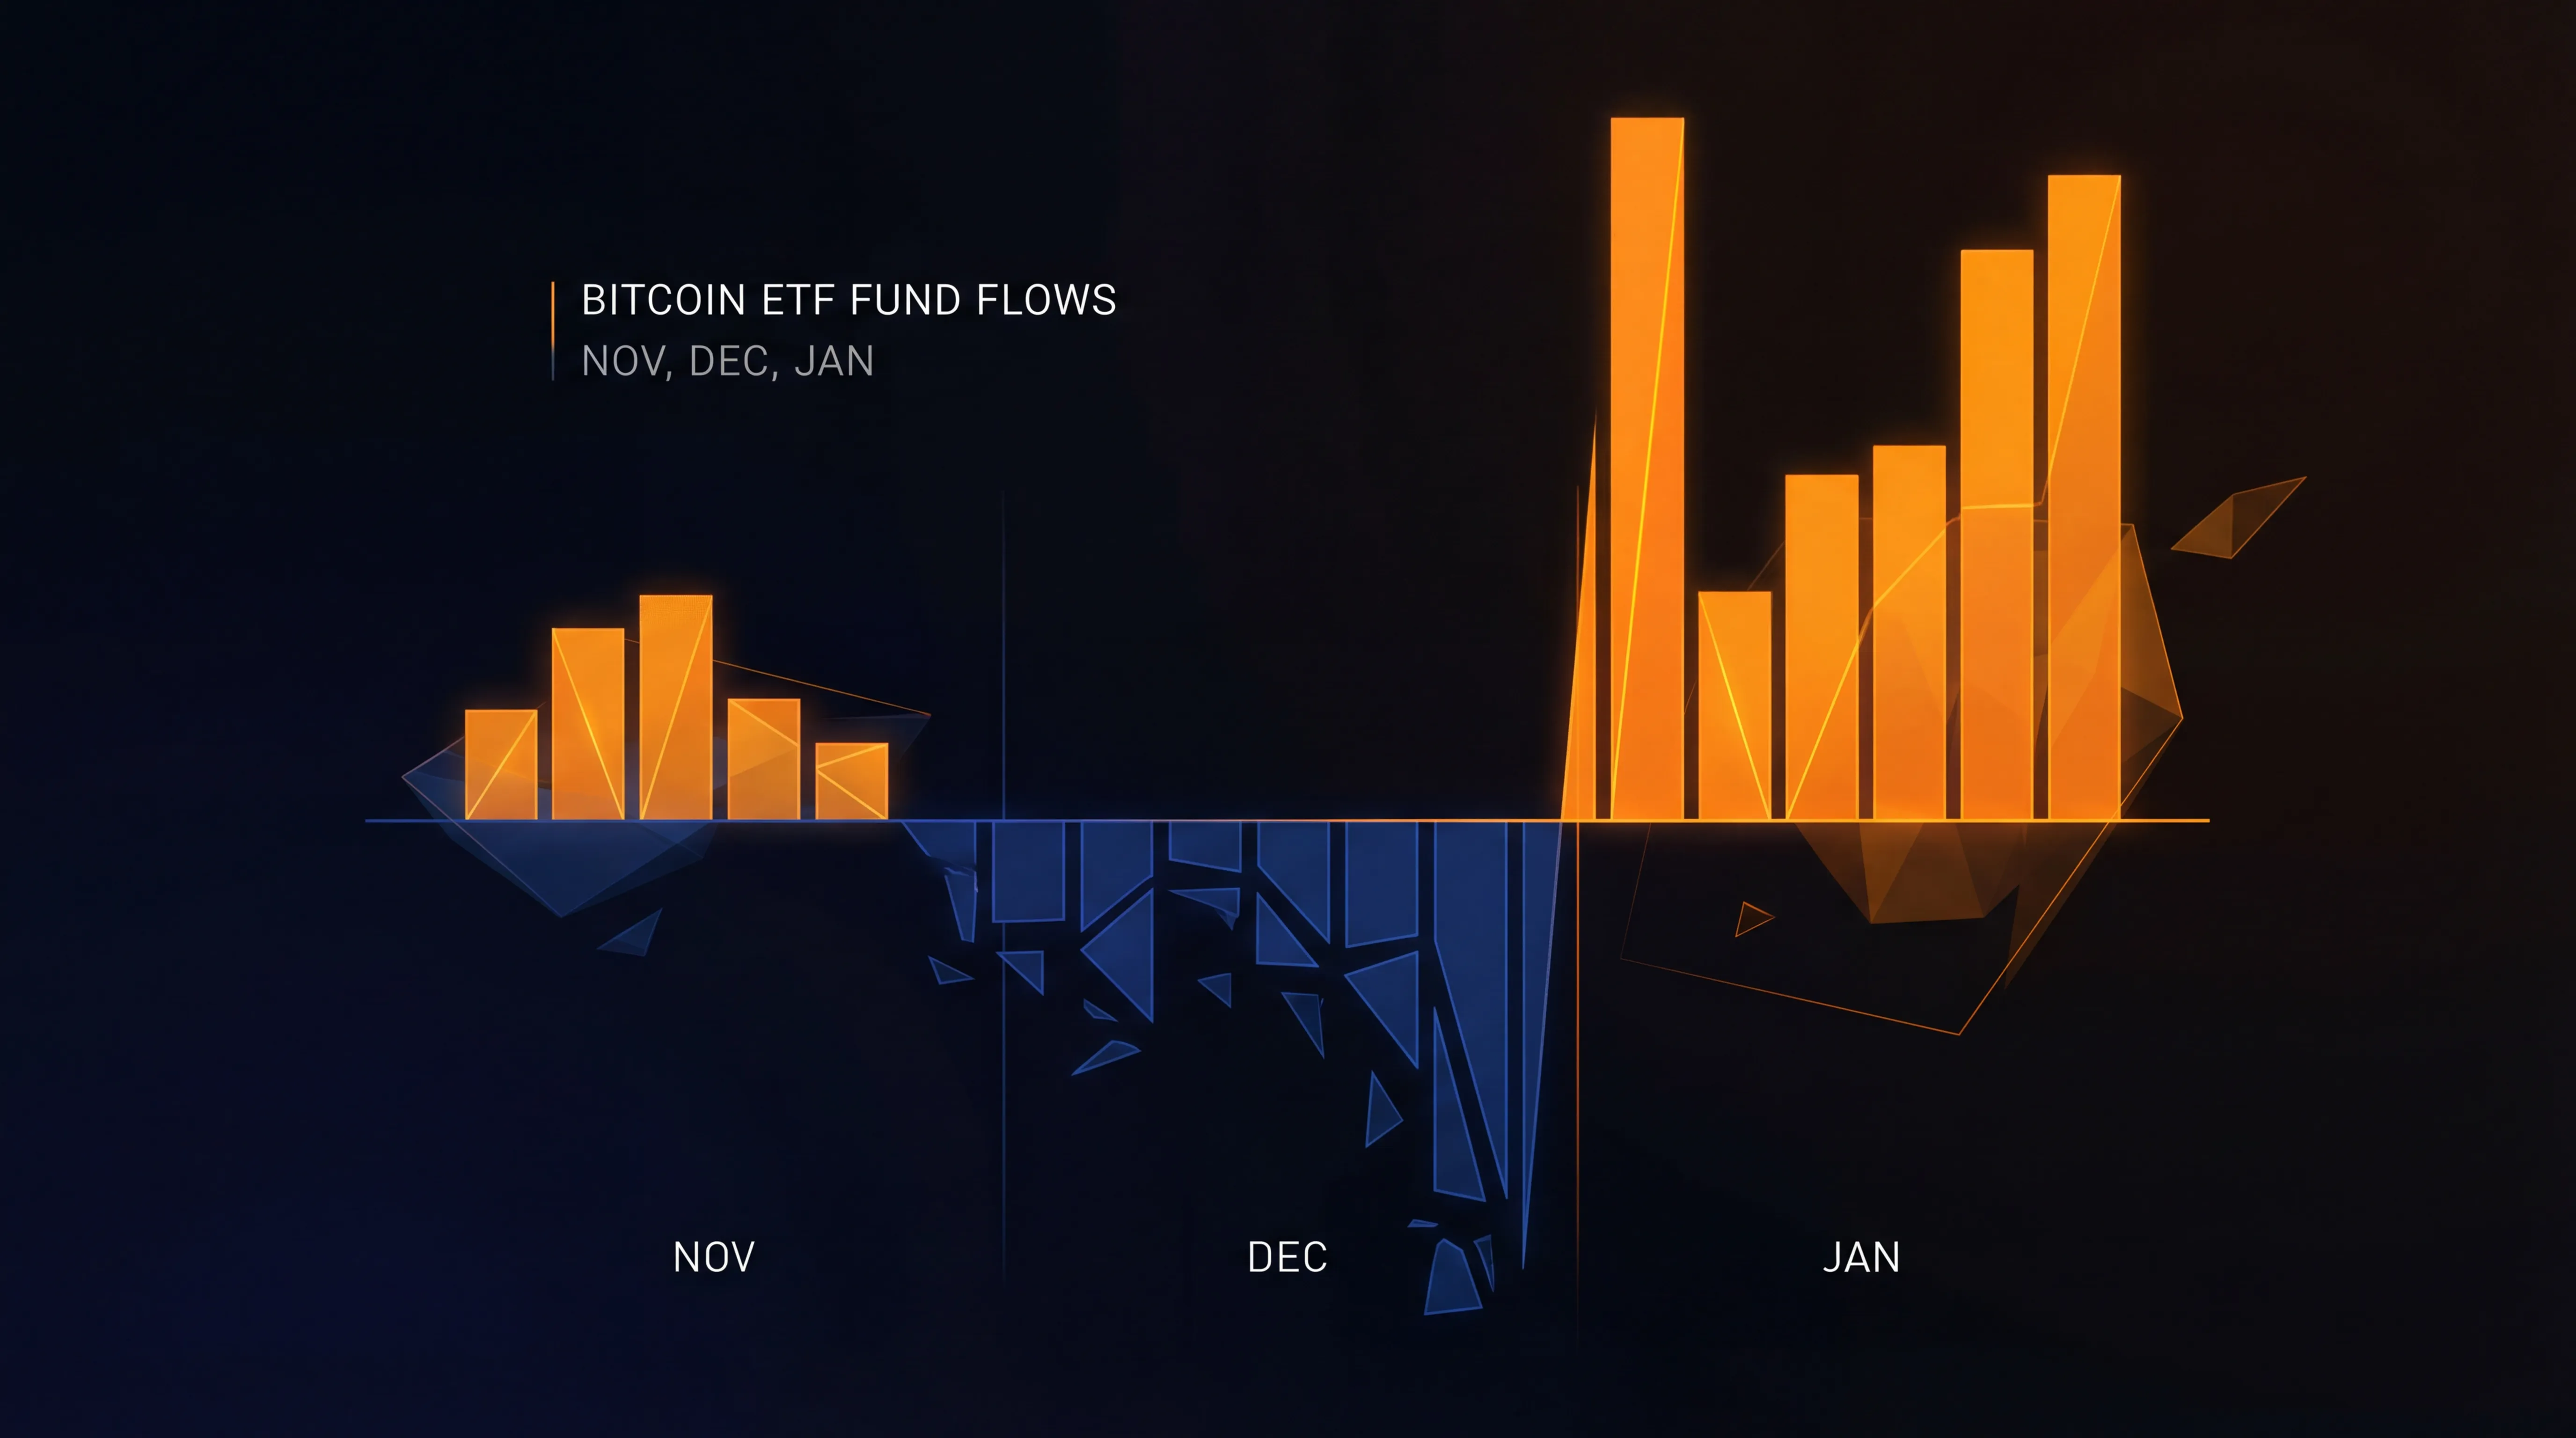
Bitcoin ETFs just whipsawed through their most volatile period yet. November and December brought $4.57 billion in outflows, the worst two-month stretch on record. Then, over three trading days in mid-January, $1.66 billion came roaring back in. Bitcoin rallied from $87,000 to nearly $94,000. Institutional buyers looked like they were back.
That lasted about two weeks.
By late January, flows turned negative again. Bitcoin fell to $68,500 where it sits today, down 27% from the January peak and 46% from October’s all-time high of $126,080. On February 13, even BlackRock’s unstoppable iShares Bitcoin Trust (IBIT) saw its first outflows in weeks.
So what’s actually happening? Is institutional appetite for Bitcoin dying, or just getting pickier?
The record exodus wasn’t panic
Start with the damage. U.S. spot Bitcoin ETFs shed $3.48 billion in November and another $1.09 billion in December, according to SoSoValue data. That $4.57 billion total beat the previous worst stretch (February-March 2025) by $250 million.
Bitcoin’s price fell roughly 20% during the same period, which makes the outflows look like a panic exit. But the structure tells a different story.
Vikram Subburaj, CEO of crypto exchange Giottus, put it bluntly in comments to CoinDesk:
“ETF outflows and steady liquidations are weighing on sentiment, but the structure does not resemble panic. Instead, this appears to be a market in equilibrium, as weak hands are exiting into year-end and stronger balance sheets are absorbing supply.”
Translation: tax-loss harvesting and year-end rebalancing, not a crisis of faith. VanEck’s January ChainCheck report backed this up, noting that “what many would describe as ‘tax loss harvesting’ seemed to start in October this year.”
And here’s the kicker: while Bitcoin ETFs bled, other crypto products surged. XRP ETFs pulled in over $1 billion during the same period. Solana ETFs grabbed more than $500 million. This wasn’t a wholesale exit from crypto. It was rotation.
The three-day snap-back
On January 6, Bitcoin ETFs recorded their largest single-day inflow since October 7: $697.2 million. But the real surge came January 12-14, when $1.66 billion poured in over three trading days.
BlackRock’s IBIT led the charge with $648.39 million on January 14 alone, its biggest single day of 2026. Bitcoin climbed nearly 7% during the rally, peaking just under $94,000.
What triggered it? VanEck identified a few catalysts:
- Softer inflation readings
- Optimism around the CLARITY Act (proposed U.S. crypto regulation)
- Oversold technical conditions after the November-December selloff
Glassnode data, cited by CoinDesk, showed that extended ETF outflow periods have historically marked local bottoms. It happened in August 2024 during the yen carry trade unwind (Bitcoin bottomed near $49,000). It happened in April 2025 during the “tariff tantrum” (support near $76,000). The pattern held again in January 2026.
BlackRock’s $62 billion moat
While the broader Bitcoin ETF market whipsawed, BlackRock’s IBIT kept doing what it’s done since launch: attracting money. As of late December, IBIT had pulled in more than $62 billion, according to Farside Investors.
Even during the January spike, IBIT grabbed a disproportionate share. And when outflows resumed in February, IBIT’s losses were modest compared to competitors.
Why does BlackRock keep winning?
Liquidity. IBIT is the largest Bitcoin ETF by assets. For institutions moving serious money, that depth matters. Slippage kills returns.
Brand. BlackRock manages over $10 trillion globally. Conservative allocators (pension funds, endowments, family offices) trust the name. You can’t get fired for buying BlackRock.
Infrastructure. They built custody, market-making, and prime broker relationships before launch. Competitors are still catching up.
Part of the outflow story is Grayscale’s GBTC, which has bled assets since converting from a closed-end fund to an ETF in January 2024. Farside data shows the ETF cohort collectively absorbed roughly $25 billion in GBTC redemptions. That’s not bearish for Bitcoin. It’s a fee arbitrage. Capital left Grayscale’s high-fee product and rotated into cheaper options like IBIT.
Bitcoin decouples from stocks (briefly)
Here’s where it gets interesting. VanEck’s analysis showed that Bitcoin’s 30-day correlation with the S&P 500 dropped to 0.18 in mid-January, the 9th percentile over the past year. That’s the lowest reading since October 2025.
At the same time, Bitcoin’s correlation with gold climbed to 0.28, above the 80th percentile. For a moment, Bitcoin started behaving less like a tech stock and more like a safe-haven asset.
The Coinbase premium index (which measures the spread between U.S. and global Bitcoin prices, a proxy for institutional demand) climbed back toward neutral, suggesting “conditions are no longer consistent with capitulation,” per CoinDesk.
But that shift didn’t last.
The leverage problem
On February 13, BlackRock’s Head of Digital Assets Research, Robert Mitchnick, issued a blunt warning about Bitcoin’s volatility. Per CoinDesk:
“Bitcoin’s fundamentals as a scarce, decentralized monetary asset remain strong, but its trading increasingly resembles a ‘levered NASDAQ,’ raising the bar for conservative investors to adopt it.”
Mitchnick blamed perpetual futures platforms, not spot ETFs, for the whipsaw price action. Bitcoin’s 90-day perpetual funding rate climbed from 3.7% in mid-December to 4.8% by mid-January, a sign of increased speculative leverage.
Open interest (the total value of outstanding Bitcoin futures) grew 7% to $32.4 billion over the same period. But when measured in BTC terms (rather than dollars), open interest was actually down 2.3% since mid-December. The price rally drove the increase, not new speculative positioning.
Still, Mitchnick’s point stands: as long as derivatives markets dominate Bitcoin’s price discovery, institutions will struggle to treat it as a portfolio hedge.
Where we stand now
February brought the hangover. On February 13, BlackRock saw net outflows from IBIT for the first time in weeks: $9.36 million. Bitcoin fell back to $68,500, erasing most of the January gains.
On-chain data from VanEck flagged weakness over the 30-day period:
- Daily network revenues: down 15%
- Active addresses: down 6%
- New addresses: down 4%
Fewer users, lower revenue, declining activity. Not a great look.
When geopolitical tensions spiked in late January, Bitcoin sold off while gold rallied. The “digital gold” narrative took another hit. Bitcoin still trades like a risk asset, not a safe haven.
What this means
The volatility in ETF flows tells us a few things:
Institutional demand is real, but selective. The $1.66 billion three-day surge in January wasn’t a fluke. Money is still flowing into Bitcoin. But it’s concentrating in BlackRock. Smaller ETFs are struggling.
ETF flows are a lagging indicator. Outflows marked the bottom in November-December. Inflows marked the top in mid-January. If you’re trading based on flow data, you’re already late.
The “ETF honeymoon” is over. These products launched in January 2024 with massive hype. Now they’re just another tool. Flows will ebb and surge with market conditions. That’s normal.
Bitcoin’s identity crisis persists. Is it digital gold or a levered tech bet? January’s brief decoupling from the S&P 500 suggested the former. February’s selloff suggests the latter. Until derivatives leverage calms down, institutions will treat Bitcoin as high-risk speculation, not a hedge.
BlackRock has built a $62 billion moat. Everyone else is fighting for scraps. That’s not bearish for Bitcoin. It’s just the reality of institutional adoption in 2026.
The infrastructure is here. The volatility is too. Get used to both.
Sources: CoinDesk, VanEck, SoSoValue, Farside Investors, CryptoSlate, Daily Crypto Briefs, Coinfomania. Bitcoin price: $68,500 as of February 16, 2026.